Conan Mercer Site Reliability Engineering Leader
Wireless Internet Connectivity of Open-Source Scientific Devices - Part 3
29 May 2020 - Conan Mercer
This article was originally published in The Journal of Chemical Education - it can be cited from here</b>Application of ESP-12E to Chemical Experiment
Data acquisition and upload to the IoT platform using the ESP-12E is performed in a simple experiment to qualitatively investigate the effect of temperature on reaction rate between sodium thiosulfate and hydrochloric acid. It is useful for introduction to students of basic collision theory, and on successful completion, provides students with a dataset accessible on the Internet. Light intensity is measured using the LDR and the measured light intensity changes when sodium thiosulfate produces colloidal sulfur according to the chemical reaction:
$$\ce{Na2S2O3(aq) + 2 HCl(aq) -> 2NaCl(aq) + S(s) + SO2(g) + H2O(aq)}$$
The LDR is connected in series with a 10 k\(\Omega\) resistor and the output voltage across the LDR is determined according to the resistive divider rule between two resistors. As a result, the output voltage varies in the range 0-3.3 V. The output of the circuit is connected to the analog-to-digital converter (ADC) of the ESP-12E (pin A0) and is used to measure the output voltage of the LDR sensor. It is assumed that any change in light intensity is proportional to this output voltage. The ESP-12E has a 10-bit ADC: therefore \(2^{10} = 1024\) quantization levels results in a sensitivity of 3.3 V/1024 = 0.0032 V in the sensor voltage output.
The IR thermometer is used to record temperature. Both light and temperature data is sampled at an interval of 500 ms, with filtering applied to the LDR data, and both temperature and light data is periodically uploaded to the ThingSpeak channel. Both the LDR and temperature sensors are clamped against the reaction vessel filled with the reactants, Figure 1.
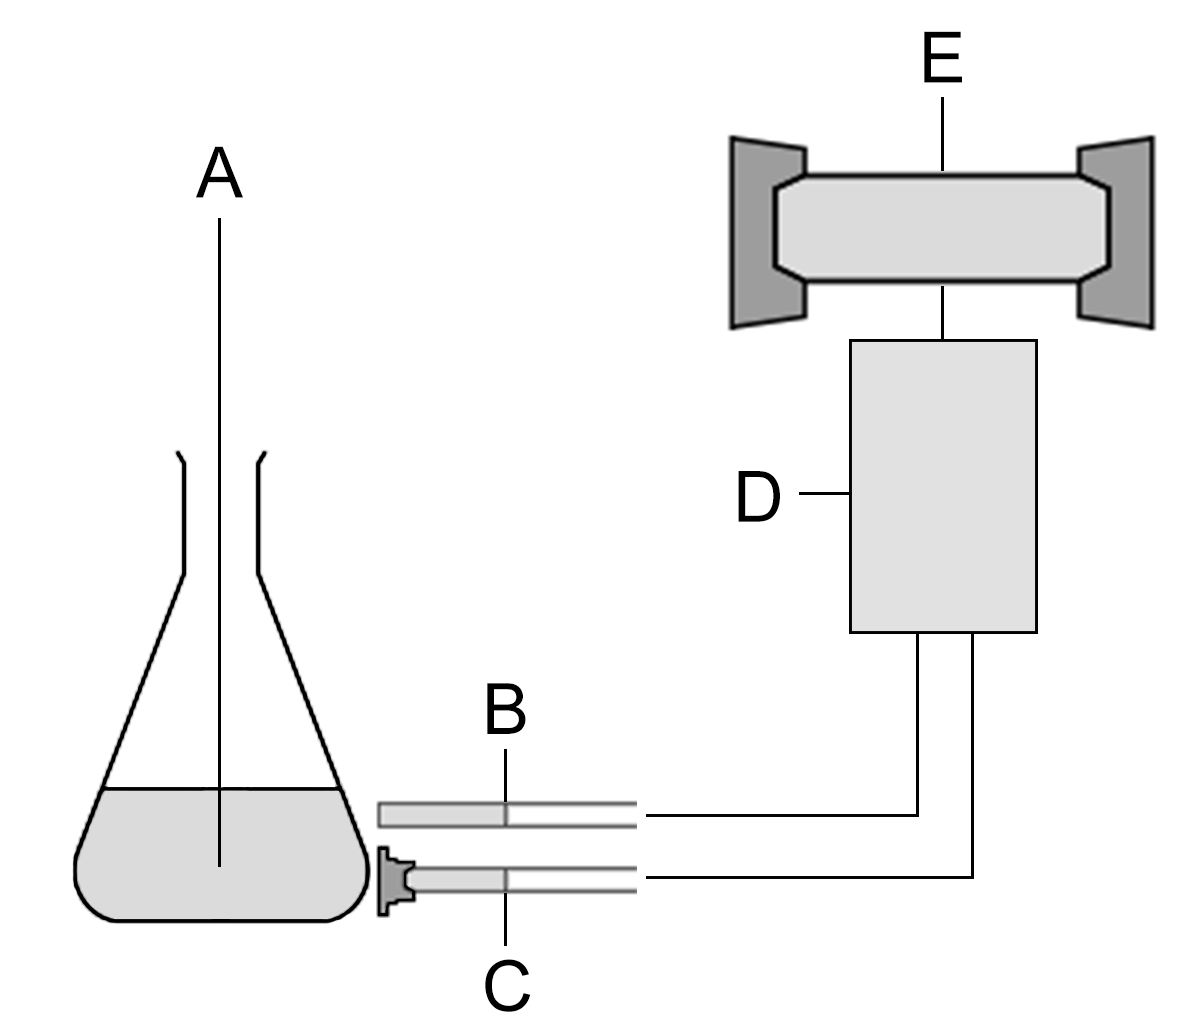
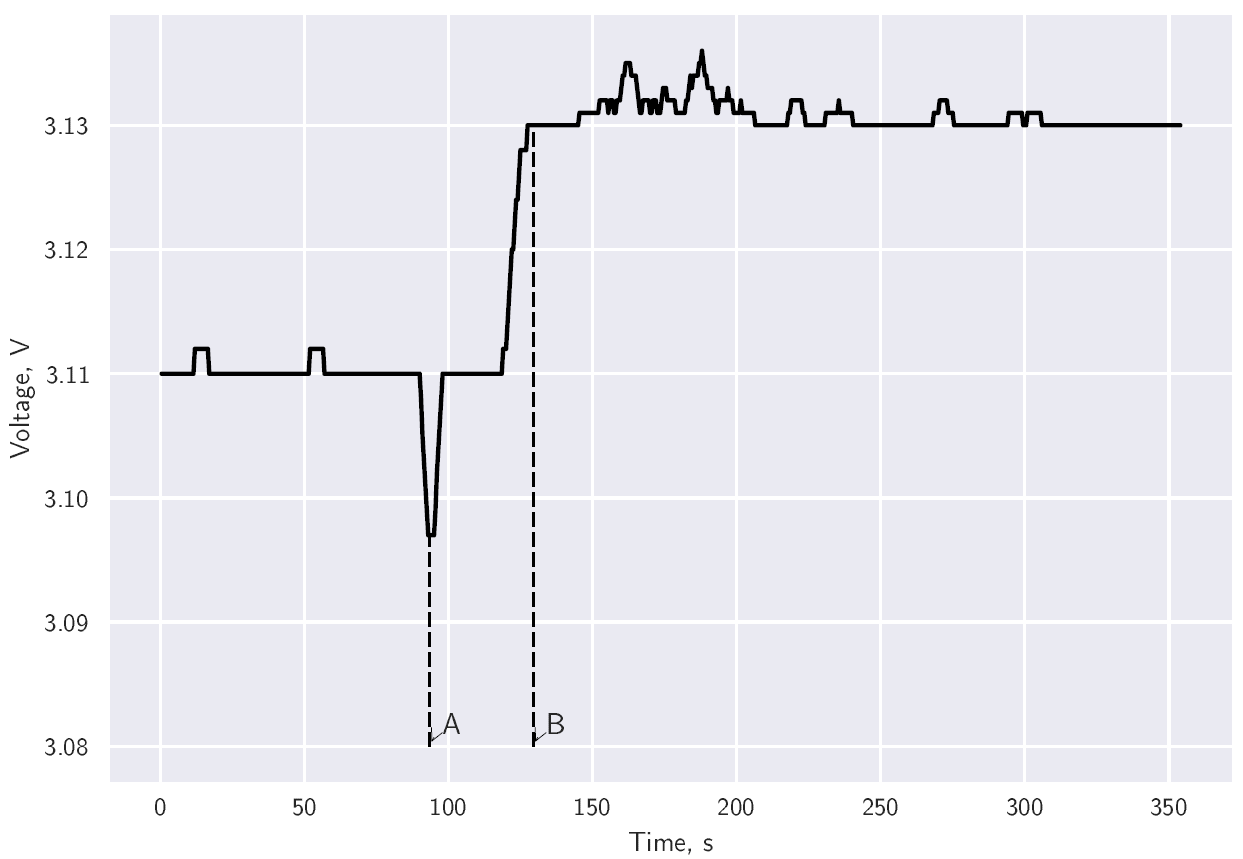
The time taken to reach the turbidity maximum is indicated as an example in Figure 2. When the pipette is moved over the reaction vessel a shadow is cast upon the LDR indicating the pipetting of \(\ce{HCl}\) into the reaction vessel. This is clearly indicated as a drop in voltage. The time difference between A and B is used to plot the graph.
The plotted graph, Figure 3, shows temperature,°C, against 1/Time, per second. This plot yields more qualitative information than a human eye colour change approach. The rate of change can be measured from the graph slope or the time taken for a change to occur. The result provides useful information for increasing students conceptual understanding of reaction rates.

Conclusion
The simple methodology laid out in this post series provides wireless internet connectivity to open-source laboratory hardware. This affords new opportunities to exploit combinatorial strategies in a wide variety of systems for both teaching and research laboratories. A classic chemical experiment is demonstrated involving the measurement of temperature and light data using a microcontroller.
Turbidity data is sent over a wireless network to a cloud-based server that is then used to plot turbidity data. This new method of wireless data acquisition is cost-effective and does not require commercial software licenses. Because all data is sent to the ThingSpeak server, it is not necessary to have desktop computers in the laboratory. Details of how to program the microcontroller are provided along with the actual code used in this post. The hardware is comprised of few parts, a microcontroller, an OLED display, IR temperature sensor and LDR.
Collectively this hardware handles data logging of temperature and light measurements, real-time display and uploading to the Internet.
This approach can be implemented and adapted into modern microcontrolled experiments where data needs to be transmitted wirelessly in a simple, powerful, and affordable manner.